Flattening and Inverting: What is The Teasury Yield Curve Telling Us?
KONTAN.CO.ID - NEW YORK, March 28 (Reuters) - The U.S. Treasury yield curve has been flattening with parts of it inverting as investors price in an aggressive rate-hiking plan by the Federal Reserve as it attempts to bring inflation down from 40-year highs.
That has investors trying to guess whether it is signaling a recession is nearing.
The shape of the yield curve is a key metric investors watch as it impacts other asset prices, feeds through to banks' returns and has been an indicator of how the economy will fare. Recent moves have reflected investor worries over whether the Fed can tighten monetary policy to tame inflation without hurting economic growth.
Investors watch parts of the yield curve as recession indicators, primarily the spread between the yield on three-month Treasury bills and 10-year notes and the U.S. two-year to 10-year curve. However these two have veered in opposite directions, causing some confusion as to how accurate a recession signal they are giving.
Other parts of the curve are less-watched, such as the spread between five- and 30-year Treasuries which inverted on Monday and has also inverted prior to some recessions.
Here is a quick primer explaining what a steep, flat or inverted yield curve means and how it has in the past predicted recession, and what it might be signaling now.
Baca Juga: Oil Slides on Concerns of Weaker Chinese Demand
What should the curve look like?
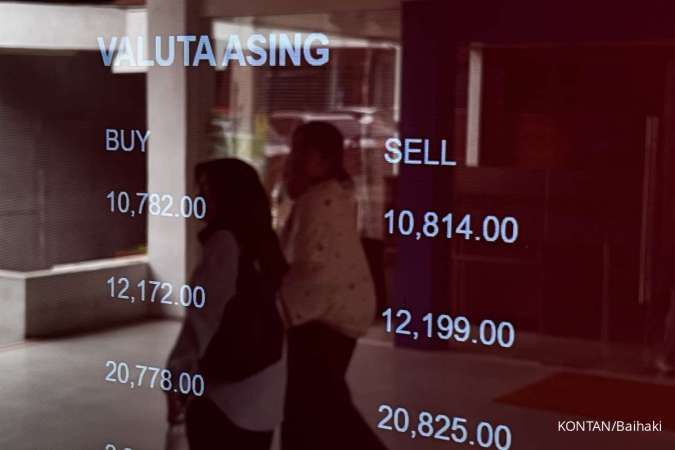
The U.S. Treasury finances federal government budget obligations by issuing various forms of debt. The $23 trillion Treasury market includes Treasury bills with maturities from one month out to one year, notes from two years to 10 years, as well as 20- and 30-year bonds.
The yield curve plots the yield of all Treasury securities.
Typically, the curve slopes upwards because investors expect more compensation for taking on the risk that rising inflation will lower the expected return from owning longer-dated bonds. That means a 10-year note typically yields more than a two-year note because it has a longer duration. Yields move inversely to prices.
A steepening curve typically signals expectations of stronger economic activity, higher inflation, and higher interest rates. A flattening curve can mean the opposite: investors expect rate hikes in the near term and have lost confidence in the economy's growth outlook.
Baca Juga: JPMorgan Cuts EM Local Currency Debt to Underweight as Russia-Ukraine Woes Bite
What does an inverted curve mean?
The U.S. curve has inverted before each recession since 1955, with a recession following between six and 24 months, according to a 2018 report by researchers at the Federal Reserve Bank of San Francisco. It offered a false signal just once in that time.
The last time the 2/10 part of the yield curve inverted was in 2019. The following year, the United States entered a recession - albeit one caused by the global pandemic.
Why is the yield curve inverting now?
Yields of short-term U.S. government debt have been rising quickly this year, reflecting expectations of a series of rate hikes by the U.S. Federal Reserve, while longer-dated government bond yields have moved at a slower pace amid concerns policy tightening may hurt the economy.
As a result, the shape of the Treasury yield curve has been generally flattening and in some cases inverting.
Parts of the yield curve, namely five to 10 and three to 10 years, inverted last week.
The spread between five- and 30-year U.S. Treasury yields on Monday fell to as low as minus 7 basis points (bps) US5US30=TWEB, moving below zero for the first time since February 2006, according to Refinitiv data.
The spread has collapsed from a positive 53 bps at the start of this month. The 5/30 year spread inverted prior to the 2008-09 recession and prior to the 2001 recession, but not prior to the pandemic-induced 2020 recession.
In the overnight index swaps (OIS) market, the yield curve between two- and 10-year swap rates inverted for the first time since late 2019 and last stood at minus 4 bps, according to Refinitiv data.
Two parts of the curve are particularly closely watched: One is the gap between yields on two- and 10-year Treasury notes US2US10=RR, widely seen to predict a recession when it inverts. That spread was at 12.1 basis points from 24 basis points 10 days ago.
Baca Juga: Gold Prices Set for Weekly Gain as Ukraine Conflict Deepens
Are we getting mixed signals?
Still, another closely monitored part of the curve has been giving off a different signal: The spread between the yield on three-month Treasury bills and 10-year notes this month has been widening, causing some to doubt a recession is imminent.
Meanwhile, the two-year/10-year yield curve has technical issues, and not everyone is convinced the flattening curve is telling the true story. They say the Fed's bond buying program of the last two years has resulted in an undervalued U.S. 10-year yield that will rise when the central bank starts shrinking its balance sheet, steepening the curve.
U.S. benchmark 10-year yields pushed above the 2.5% marker to 2.55% Monday, hitting their highest since April 2019. In February they topped the 2% level for the first time since 2019.
Researchers at the Fed, meanwhile, put out a paper on March 25 that suggested the predictive power of the spreads between 2 and 10-year Treasuries to signal a coming recession is "probably spurious," and suggested a better herald of a coming economic slowdown is the spread of Treasuries with maturities of less than 2 years.
Baca Juga: Oil Slumps as Shanghai Shuts to Curb Covid Surge
What does this mean for the real world?
While rate increases can be a weapon against inflation, they can also slow economic growth by increasing the cost of borrowing for everything from mortgages to car loans.
Aside from signals it may flash on the economy, the shape of the yield curve has ramifications for consumers and business.
When short-term rates increase, U.S. banks tend to raise their benchmark rates for a wide range of consumer and commercial loans, including small business loans and credit cards, making borrowing more expensive for consumers. Mortgage rates also rise.
When the yield curve steepens, banks are able to borrow money at lower interest rates and lend at higher interest rates. Conversely, when the curve is flatter they find their margins squeezed, which may deter lending.